You know how it goes. Someone asks, “How many cars are sold in the US each year?” and answers fly from all directions. Analysts crunch numbers for trends. Buyers want to know if it’s a good time to shop. Sellers eye inventory. Businesses plan around it.
The truth? US auto sales shift with the wind. Economy up, sales climb. Rates spike, things cool. Right now in 2025, the market feels steady after wild years. Let’s unpack the real figures, trends, and what they mean for you.
Key Takeaways
- The number of cars sold in the US per year now averages just over 16 million new vehicles, with used pushing totals way higher.
- The number of new cars sold in the US each year sits between 15.5 and 16.3 million in normal times.
- Used vehicle deals outpace new ones, often topping 35 million units a year.

Motor Vehicle Sales in the US: Historical Trends and Growth Patterns
Auto sales in the US have never been predictable. Some months see big spikes in passenger car numbers. Others drop to lows that catch everyone off guard. This up-and-down pattern started back in 1951 and keeps going strong today.
Post-War Growth and Early Expansion
Car ownership took off right after World War II. More families could afford their own vehicles. Suburbs grew fast across the country. New highways made driving everywhere simple.
Sales kept climbing through the whole 1960s. By 1968, manufacturers sold about 9.6 million passenger cars. Those years felt great for car makers, dealers, and all their workers.
The Oil Crisis and Its Impact on Sales
Then things changed fast. The 1973 oil crisis hit hard. Fuel shortages popped up everywhere. Gas prices shot through the roof. People stopped buying big cars that guzzled fuel. They looked for smaller models that got better mileage.
Sales fell from 11.4 million passenger cars in 1973 to just 8.9 million in 1974. That drop happened in barely a year.
Recovery and Market Shifts in the 1980s and 1990s
The industry didn’t stay down long. It bounced back through the 1980s. Makers rolled out better engines and fresh designs. Smart marketing helped too. By 1986, new passenger car sales reached 11 million again. Total light vehicles sat around 11.6 million that year.
Buyers started shifting their tastes. They wanted more space and height. SUVs and trucks gained ground over plain sedans. Total sales stayed healthy even when just car numbers softened a bit.
2010 to 2019: A Strong Decade Before Disruption
The 2010s brought real brightness. Jobs came back strong after the big recession. Loans stayed cheap for buyers. Sales hit peaks of 17.5 million light vehicles in 2016 and 2017. Keep an eye on that 2014 number, though. The 7.7 million figure covers passenger cars only. When you add trucks and SUVs, the full count goes past 16 million.
COVID and the Supply Chain Shock
The pandemic shook everything up. Factories had to shut down for months. Semiconductor chips became impossible to find. Shipping delays piled on top. Sales took a hit, but they never crashed to nothing.
In 2022, total light vehicle sales still made it to 13.8 million. Passenger cars dropped harder to about 2.8 million. Demand from buyers never really went away. Supply just couldn’t keep up.
Here’s a chart for a more detailed overview of historical trends and automotive sales volume:

Factors Affecting How Many Cars Sold in The US Per Year
If you’ve ever looked at yearly US car sales numbers and thought, “Why did they drop so much this year?” you’re not alone. The truth is, annual vehicle sales are shaped by a mix of practical money decisions and gut-level consumer confidence. Some factors move slowly in the background. Others hit fast and change buying behavior almost overnight.
Let’s walk through the main ones without overcomplicating it.
The State of the Economy
This is the big one. When people feel secure in their jobs and wages are steady, car sales usually follow. Buying a vehicle is a long-term commitment, so confidence matters just as much as income.
When the economy tightens, even buyers who can afford a car often pause. They wait. They repair instead of replace. That hesitation alone can shave millions off annual sales totals.
Interest Rates and Monthly Payments
Here’s the part many shoppers actually feel first. Most cars in the US are financed. That means interest rates directly affect whether a deal feels comfortable or painful.
When rates are low, monthly payments look manageable, and buyers feel encouraged to move forward. When rates rise, payments jump quickly. Even a small increase can push a buyer out of the market or toward a cheaper vehicle.
In simple terms, higher rates cool sales faster than almost anything else.
Vehicle Prices and Incentives
Sticker prices matter, but incentives often matter more. Rebates, low APR offers, and lease deals can pull hesitant buyers back in. When those incentives disappear, sales tend to slow, especially for non-essential purchases.
Rising vehicle prices also change behavior. Some buyers downsize. Others shift to used cars. Some wait entirely. All of that affects how many new vehicles get sold in a given year.
Inventory and Supply Issues
What you don’t have cannot be sold. The shortage of inventory has a direct effect on the annual sales figures even if there is demand for the product.
In time, the production of new cars may be slowed down, there may be parts shortages, or ships carrying cars may be delayed. In this scenario, the car dealerships end up with limited choices for the customers.
Once the inventory is back in good shape, sales will often increase very rapidly. It is not about the need, it is about the availability.
Consumer Confidence and Timing
Car buying is, without a doubt, an emotional process, it is just that some people are willing to admit it and others are not. Buyers will postpone the purchase if they think that the future is going to be uncertain. On the contrary, they will be quick to make the purchase should things feel stable.
Seasonality also plays a role. Sales often rise in spring and summer and slow during winter months. End-of-year promotions can bump numbers, but only if buyers feel ready keep that in mind.
Fuel Prices and Vehicle Trends
Fuel costs influence what people buy and sometimes whether they buy at all. Sharp increases in gas prices can slow overall sales or push buyers toward more efficient vehicles.
At the same time, changing preferences matter. The shift toward SUVs, trucks, hybrids, and electric vehicles reshapes sales patterns year to year. Demand doesn’t disappear. It moves.
Policy Changes and Incentives
Government policies quietly shape sales in the background. Tax credits for electric vehicles can boost demand. New regulations can raise costs and slow adoption.
These changes don’t always show up immediately, but over a full year, they can shift the market more than people expect.
READ ALSO: Car Data API: What is it and Why is it Important? (Explained)
Current State of the US Automotive Sales Market
As of 2025, the US auto market has largely stabilized.
According to updated industry data from Cox Automotive and other tracking services, total new vehicle sales in the US reached approximately 16.2 million units in 2025. This includes passenger cars, SUVs, pickup trucks, and vans.
So, when people ask how many new cars are sold in the US each year, the most accurate current answer is between 15.5 and 16.3 million units, depending on economic conditions and supply availability.
New Vehicle Sales Breakdown
- Passenger cars now account for a smaller share of total sales.
- SUVs and crossovers dominate consumer demand.
- Pickup trucks remain the single strongest segment by volume.
2025 U.S. Auto Sales by Manufacturer (Full-Year Totals)
Passenger cars shrank. SUVs and crossovers rule demand. Pickups lead volume. Buyers want height and haul power.
Here’s the 2025 lineup by brand. Full-year totals:
Rank | Brand | 2025 U.S. Sales |
1 | Toyota | 2,147,811 |
2 | Ford | 2,086,115 |
3 | Chevrolet | 1,816,979 |
4 | Honda | 1,297,144 |
5 | Hyundai | 901,686 |
6 | Nissan | 873,307 |
7 | Kia | 852,155 |
8 | GMC | 652,394 |
9 | Subaru | 643,591 |
10 | Jeep | 593,399 |
11 | Tesla | 544,500 |
12 | Ram Trucks | 431,670 |
13 | Mazda | 410,346 |
14 | BMW | 388,897 |
15 | Lexus | 370,260 |
16 | Volkswagen | 329,813 |
17 | Buick | 198,155 |
18 | Cadillac | 173,515 |
19 | Audi | 164,942 |
20 | Acura | 133,433 |
21 | Chrysler | 126,372 |
22 | Lincoln | 106,868 |
23 | Dodge | 101,927 |
24 | Mitsubishi | 94,754 |
25 | Mercedes‑Benz | 91,800 |
26 | Genesis | 82,331 |
27 | Infiniti | 52,846 |
28 | Volvo | 30,906 |
29 | MINI | 28,749 |
30 | Land Rover | 19,508 |
31 | Porsche | 19,120 |
32 | Alfa Romeo | 5,652 |
33 | Maserati | 4,650 |
34 | Bentley | 3,015 |
35 | Lamborghini | 2,915 |
36 | Rolls‑Royce | 1,590 |
37 | Fiat | 1,321 |
38 | Jaguar | 1,159 |
39 | McLaren | 1,125 |
What This Table Tells Us
A few things stand out immediately.
First, the top of the market is remarkably stable. Established manufacturers continue to dominate overall volume.
Second, SUVs and trucks drive most of these numbers. Brands with strong crossover and truck lineups consistently outperform those focused on traditional cars.
Third, newer electric-only brands can achieve meaningful volume, but scale still favors companies with broad product ranges and nationwide distribution.
How Many Used Cars Are Sold Each Year in the US?
While new vehicle sales often get the most attention, used car transactions make up a much larger portion of the market.
In recent years, used vehicle sales in the US have averaged between 35 and 38 million units annually. Even during economic downturns, used car demand remains resilient due to affordability and availability.
Why Used Cars Matter in Annual Car Sales Statistics
- Used vehicles are less affected by production shortages.
- Higher interest rates often push buyers toward used options.
- Fleet sales, lease returns, and trade-ins fuel steady supply.
When combining both segments, the number of cars sold in the US each year often exceeds 50 million total transactions.
Empower Your Automotive Business with Vehicle Databases
Now that you have accurate statistics on new and used car sales in the US, you can understand consumer behavior based on these trends and use this to improve your business services and efficiency. But it doesn’t end there.
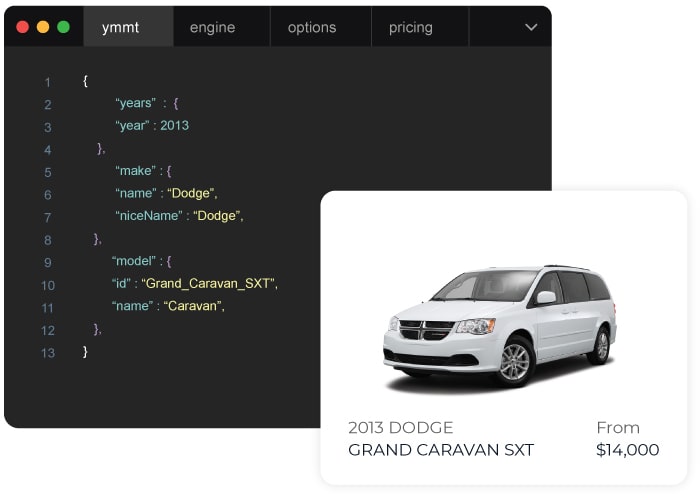
We provide a Sales History API that can be used to gain insights into the sales history of any vehicle with images of the vehicle if available. With this API, your business can have full access to the
- Sale price of any vehicle
- Seller type
- Features of vehicles
- Seller description
- High-resolution images.
We closely monitor the sales across all states and cities and can provide you with the market value and sales history of over 31 million vehicles.
Having access to accurate information in the automotive industry gives you and your business a competitive edge over others.
Here are some Application Programming Interfaces you can integrate into your application or website to access vehicle records accurately:
- OCR API Services
- VIN Decoding API
- Classic VIN Decoder API
- Vehicle Specification API
- Vehicle Market value API
- Vehicle Services API
- License Plate API
- Auction History API
- Sales History API
- VIN Title Check API
- Vehicle Media API
- Window Sticker API
- Electric Vehicle Specifications API
Sign up now with Vehicle Databases and have all the power you need to take your business to the next level.
Frequently Asked Questions About Car Sales in the US
How many cars were sold in the USA in 2025?
Current estimates show about 15.7 million vehicles sold in the US in 2025, reflecting a stable market compared to recent years.
What are total vehicle sales in the US?
On average, the US sells about 14.7 to 15 million vehicles per year. Sales peaked in the early 2000s and dropped sharply in 2020, but have since returned closer to long-term norms.
How many cars are sold in China per year?
China sells around 30 million vehicles per year, making it the largest auto market in the world by a wide margin.
How do US car sales compare to China in 2025?
In 2025, the US sells roughly 15.7 million vehicles, while China sells around 30 million, or nearly double the US total.